The Miserable Starts Of The Celtics, Thunder, & Lakers In Light Of History
The Miserable Starts Of The Celtics, Thunder, & Lakers In Light Of History
The Thunder, Celtics, and Lakers are struggling, but that doesn't necessarily mean they won't be gunning for a title later in the year.

As the first week of the new 2017-18 NBA season comes to a close and we’ve been able to get a couple different looks at all the new teams, the annual tradition of the NBA media beginning to press panic buttons has already set in: the Lakers starting 0-3, the Celtics' offense stagnating, the Thunder’s troubles with and without Westbrook. Is it too soon to start worrying? Last season the Cavs started 3-4 before finishing 50-32, and the Pistons had a 14-6 through two months before finishing under .500. How seriously should we take a team’s first couple of games?
We here at FloSports decided to take a look at the significance of a team’s performance during the beginning of the season to see if the first few games end up mattering come April.
In order to do this, I regressed each team’s month-by-month record over the past five years against their final record to see at what point we can really start declaring teams as “legit” or “busts.” First, let’s look at how much we can know by the end of October.
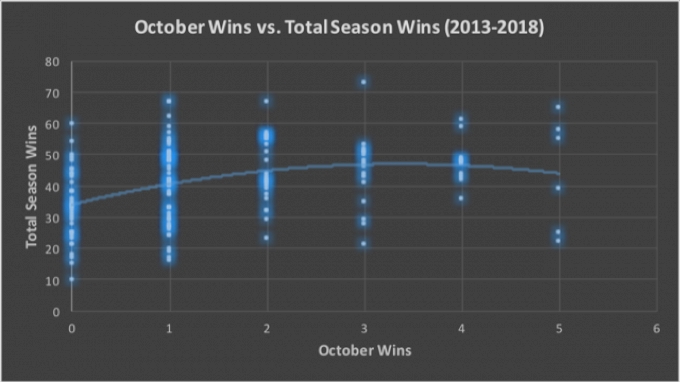
As you can see from the chart, there doesn’t appear to be a huge trend between winning games early and having a good record at the end of the year. In fact, two teams that started off the season with five wins in October last year — the Detroit Pistons and Memphis Grizzlies — both ended up in the lottery. Regressing both wins and losses against the total number of wins at the end of the season yielded an R^2 value of just 0.223, meaning that only 20 percent of the variation in a team’s total wins can be attributed to their record in the first month.
How about through the first two months of the season, though?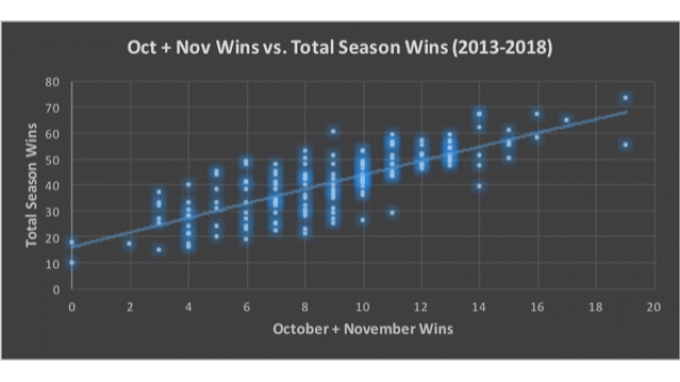
Compared to the first chart — in which the trendline looked relatively flat — here you can start to see a clear upward sloping correlation. Teams that have a high number of wins by the end of November tend to have a high number of wins by the end of the season.
Of course, there are still outliers. Players who get hot at the beginning of the season tend to cool off as fatigue starts to build up. Aaron Gordon was shooting a scorching 44 percent from three through the first two months of the 2017-18 season before declining to a much more average 29 percent for the rest of the year. Things like injuries, trades, and minutes distributions can also vastly change the composition of a team’s lineup throughout the season. The regression of the first two months’ wins yielded a R^2 value of 0.686, which is a huge leap up from 0.223.
Finally, let’s look at the wins through the new year.
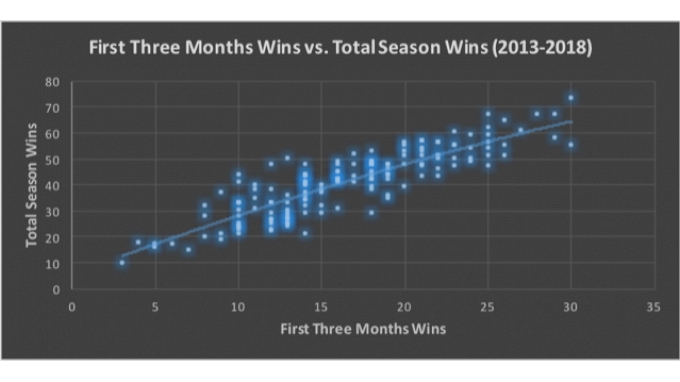
While the upward trajectory of the trendline looks very similar to the graph from the first two years, the width of the band of dots surrounding that trendline looks to have shrunk significantly. The R^2 value backs this up, jumping up from 0.686 to 0.793.
So how can we interpret this graph? Well the model predicts that a team with 15 wins by the end of December will turn out to be around a 40-win team by the end of the season, and while there is still certainly room for variance, 50 percent of teams with 15 wins by the end of December will end up with between 36 and 44 wins. While the difference between a 36- and 44-win team could certainly be the difference between making or not making the playoffs, the model is best used to gain more certainty about teams on the far ends of the distribution scale.
While plenty of teams who only have one or two wins by the end of October end up with 40- and 50-win seasons, teams who are bad by the end of the first three months tend to stay bad, and teams with high win numbers tend to stay good. Therefore, while we should certainly feel free to keep trying to break down what’s wrong with these new Lakers, be careful when reaching for the “blow-it-up” button after just a couple of games.
Fri Lavey is a writer and consultant who studied economics and statistics at Harvard University. He has previously worked as a data analyst for the NBA, the MLB, and the Philadelphia 76ers.